As a data scientist, one of the best things about working with DataRobot customers is the sheer variety of highly interesting questions that come up. Recently, a prospective customer asked me how I reconcile the fact that DataRobot has multiple very successful investment banks using DataRobot to enhance the P&L of their trading businesses with my comments that machine learning models aren’t always great at predicting financial asset prices. Peek into our conversation to learn when machine learning does—and doesn’t—work well in financial markets use cases.
Why is machine learning able to perform well in high frequency trading applications, but is so bad at predicting asset prices longer-term?
While there have been some successes in the industry using machine learning for price prediction, they have been few and far between. As a rule of thumb, the shorter the prediction time horizon, the better the odds of success.

Generally speaking, market making use cases that DataRobot (and other machine learning approaches) excel at share one or more of the following characteristics:
- For forward price prediction: a very short prediction horizon (typically within the next one to 10 seconds), the availability of good order book data, and an acknowledgment that even a model that is 55%–60% accurate is useful—it’s ultimately a percentage game.
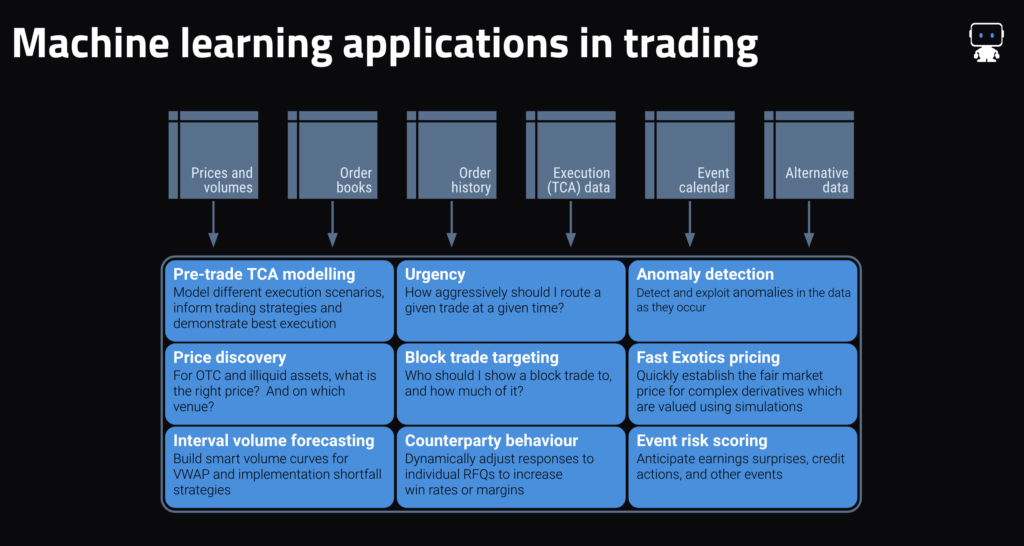
- For price discovery (e.g., establishing an appropriate price illiquid securities, predicting where liquidity will be located, and determining appropriate hedge ratios) as well as more generally: the existence of good historical trade data on the assets to be priced (e.g., TRACE, Asian bond market reporting, ECNs’ trade history) as well as a clear set of more liquid assets which can be used as predictors (e.g., more liquid credits, bond futures, swaps markets, etc.).
- For counterparty behavior prediction: some form of structured data which contains not only won trades but also unsuccessful requests/responses.
- Across applications: an information edge, for instance from commanding a large share of the flow in that asset class, or from having customer behavior data that can be used.
Areas where any form of machine learning will struggle are typically characterized by one or more of these aspects:
- Rapidly changing regimes, behaviors and drivers: a key reason why longer-term predictions are so hard. We very often find that the key model drivers change very regularly in most financial markets, with a variable that’s a useful indicator for one week or month having little information content in the next. Even in successful applications, models are re-trained and re-deployed very regularly (typically at least weekly).
- Infrequent data: a classic example here is monthly or less frequent data. In such cases, the behavior being modeled typically changes so often that by the time that enough training data for machine learning has accrued (24 months or above), the market is in a different regime. For what it’s worth, a few of our customers have indeed had some success at, for instance, stock selection using predictions on a one-month horizon, but they’re (understandably) not telling us how they’re doing it.
- Sparse data: where there’s insufficient data available to get a good picture of the market in aggregate, such as certain OTC markets where there aren’t any good ECNs.
- An absence of predictors: in general, data on past behavior of the variable being predicted (e.g., prices) isn’t enough. You also need data describing the drivers of that variable (e.g., order books, flows, expectations, positioning). Past performance is not indicative of future results… .
- Limited history of similar regimes: because machine learning models are all about recognising patterns in historical data, new markets or assets can be very difficult for ML models. This is known in academia as the “cold start problem.” There are various strategies to deal with it, but none of them are perfect.
- Not actually being a machine learning problem: Value-at-Risk modeling is the classic example here—VaR isn’t a prediction of anything, it’s a statistical summation of simulation results. That said, predicting the outcome of a simulation is an ML problem, and there are some good ML applications in pricing complex, path-dependent derivatives.
Finally, and aside from the above, a critical success factor in any machine learning use case which shouldn’t be underestimated is the involvement of capable and motivated people (typically quants and sometimes data scientists) who understand the data (and how to manipulate it), business processes, and value levers. Success is usually driven by such people carrying out many iterative experiments on the problem at hand, which is ultimately where our platform comes in. As discussed, we massively accelerate that process of experimentation. There’s a lot that can be automated in machine learning, but domain knowledge can’t be.
To summarize: it’s fair to say that the probability of success in trading use cases is positively correlated with the frequency of the trading (or at least negatively with the holding period/horizon) with a few exceptions to prove the rule. It’s also worth bearing in mind that machine learning is often better at second-order use cases such as predicting the drivers of markets, for instance, event risk and, to some extent, volumes, rather than first-order price predictions— subject to the above caveats.
About the author

Managing Director, Financial Markets Data Science
Peter leads DataRobot’s financial markets data science practice and works closely with fintech, banking, and asset management clients on numerous high-ROI use cases for the DataRobot AI Platform. Prior to joining DataRobot, he gained twenty-five years’ experience in senior quantitative research, portfolio management, trading, risk management and data science roles at investment banks and asset managers including Morgan Stanley, Warburg Pincus, Goldman Sachs, Credit Suisse, Lansdowne Partners and Invesco, as well as spending several years as a partner at a start-up global equities hedge fund. Peter has an M.Sc. in Data Science from City, University of London, an MBA from Cranfield University School of Management, and a B.Sc. in Accounting and Financial Analysis from the University of Warwick. His paper, “Hunting High and Low: Visualising Shifting Correlations in Financial Markets”, was published in the July 2018 issue of Computer Graphics Forum.


