Table Of Contents:
1) Business Problem
2) Data description
3) Exploratory Data Analysis
4) Data preparation/Feature engineering
5) Model Building
6) Submit model on Kaggle
1. Business Problem
1.1) Problem Description:
Elo Merchant Category Recommendation” challenge that is about helping understand customer loyalty using machine learning. Elo, a large Brazilian payment brand (focused on debit and credit cards), has built machine learning models to understand the most important aspects in their customers life-cycle.
However, there is a major limitation to their existing models. So far none of their models is specifically tailored for a particular individual or a profile.
That means that Elo cannot deliver fully personalized brand recommendations to its customers, nor can it filter unwanted ones.
What is loyalty? According to the Data_Dictionary.xlsx, loyalty is a numerical score calculated 2 months after historical and evaluation period.
Additionally, by looking at historical_transactions.csv and new_merchant_transactions.csv, we can find that the historical transactions are the transactions occurred before the “reference date” and new merchant transactions – the ones that occurred after the reference date (according to the ‘month_lag’ field, which is generously described as “month lag to reference date”).
We need to “develop algorithms to identify and serve the most relevant opportunities to individuals, by uncovering signals in customer loyalty”.
Competition description:
Imagine being hungry in an unfamiliar part of town and getting restaurant recommendations served up, based on your personal preferences, at just the right moment. The recommendation comes with an attached discount from your credit card provider for a local place around the corner!
Right now, Elo, one of the largest payment brands in Brazil, has built partnerships with merchants in order to offer promotions or discounts to cardholders. But do these promotions work for either the consumer or the merchant? Do customers enjoy their experience? Do merchants see repeat business? Personalization is key.
1.2 Problem Statement
Elo has built machine learning models to understand the most important aspects and preferences in their customers’ lifecycle, from food to shopping. But so far none of them is specifically tailored for an individual or profile. This is where you come in.
In this competition, Kagglers will develop algorithms to identify and serve the most relevant opportunities to individuals, by uncovering signal in customer loyalty. Your input will improve customers’ lives and help Elo reduce unwanted campaigns, to create the right experience for customers.
1.3 Real world/Business Objectives and constraints
Objectives:
- Predict loyalty score to improve customers’ lives and help Elo reduce unwanted campaigns.
- Minimize the difference between predicted and actual rating (RMSE)
1.4) Dataset Source:
Data Source: https://www.kaggle.com/c/elo-merchant-category-recommendation/data
Competition link: https://www.kaggle.com/c/elo-merchant-category-recommendation/overview
2) Dataset Overview
The datasets are largely anonymized, and the meaning of the features are not elaborated. External data are allowed
File descriptions:
train.csv – the training set
test.csv – the test set
historical_transactions.csv – up to 3 months’ worth of historical transactions for each card_id
merchants.csv – additional information about all merchants / merchant_ids in the dataset.
new_merchant_transactions.csv – two months’ worth of data for each card_id containing ALL purchases that card_id made at merchant_ids that were not visited in the historical data.
sample_submission.csv – a sample submission file in the correct format – contains all card_ids you are expected to predict for.
Data fields Data field descriptions are provided in Data Dictionary.xlsx
3) EXPLORATORY DATA ANALYSIS:
3.1) TRAIN AND TEST SET:
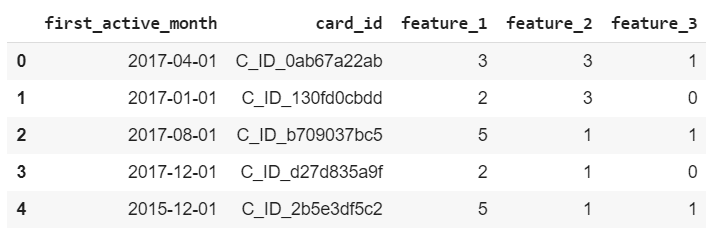
Train: It includes the ID of the card, the year and month when the card was first activated (first_active_month), and 3 anonymous classification features (feature_1, feature_2, feature_3), as well as the target variable loyalty score.
Test: The test set is the same as the training set except that there is no target variable.


As we can see there are no null values in the train set. However in the test set there is one null value. Since there is only one null value we can replace it with the mode of the column.

In the above box plot we plot the features in the train set against the target values. All the three features have a similar distribution with almost same mean and other values like min and max.
It doesn’t look like these will be helpful in predicting the target values. So we need to create additional features. Let’s plot the train and test set distribution.

From the above plot we can be sure that the train and test set have almost same distribution. So there is no need for time based splitting.
The following diagram is the histogram of the target variable.

As we can see even though it looks like the values are normally distributed around a central value if we take a closer look there are few outliers.

All of the outliers are having a value of -33.2
We cannot simply drop the outliers because these outliers can also be present in the test set. So we need to find a way to work with the outliers.
3.2) New Merchant
New_merchant_transaction: New merchant transaction data, including the merchant, is the first time the user consumes within two months. The characteristics are consistent with the historical_transaction table. The difference from the historical_transaction table is that the new transaction data month_lag is 1 or 2, and the historical transaction data month_lag From -13 to 0. According to the definition of month_lag, the transaction date where month_lag is 0 is the so-called reference date.

As we can see from the above image three features in the data set has null values. Let’s print the percentage of values missing.

In category_2 there are almost 6% percentage of the values are missing. These values should be imputed before feeding it to the model.


From the above plots we can infer that we have data for two years 2017 and 2018 and a lot of purchases are made during the year 2018 in the given data.
In the plot where we plotted the hours vs number of purchases we can see that most number of purchases are occurring between 9 AM and 7 PM.
In the last plot we can see that most of the purchases on made on the weekends. Most of the purchases are made on the days Saturday, Friday and Thursday.
So creating features like hour, whether a day is weekend or not or whether it is a holiday could be useful.


The above two plots show the purchases made month-wise for the years 2017 and 2018.
As we can see there are a lot of purchases made on the month December. Could be due to Christmas and new year. We can also see significant purchases made on October and November.
So we could create features like whether a purchase is made 90 days before a festival or not.
Let’s calculate the VIF scores and see how the variables are correlated. Value Inflation Factor is a method to check the multicollinearity between variables. You can read the part No Multicollinearity in my article Assumptions made by OLS to learn more about VIF scores.

Except for the feature authorized_flag which has a VIF score of over 30 which indicates possible correlation, all other features scores are well under 10 implying that there are no serious cases of multi-collinearity.
3.3) MERCHANT:
Merchants: Merchant information. Mainly the merchant’s pipeline information, not much help in the competition. However let’s explore this data.


Four of the features in the data set has null values. However except for category_2 the other 3 features have very small only 13 entries are null values. So, we can impute it with mode.

These three are categorical features.
Category_1 is a binary feature which takes two values Y or N
Category_2 take five values from 1 to 5
Category_3 is also a binary feature which takes values Y or N
As these are categorical features these should be one hot encoded before feeding it to the model.
Next we’ll take a look at the features numerical_1 and numerical_2

These two are numerical features. One thing to note here is that the distribution of the data for the two features looks identical. Let’s investigate further by printing the five summary statistics values.

As we can see both the features are similar. All the values are nearly same for both the features.

Even the box plot shows the same there is not much difference.
However, the features numerical_1 and numerical_2 looks more like a categorical feature than numerical.
Both the features take only 920 distinct values comparing that there are a lot of data points. Even if they are numerical they are not going to be useful as the variance of these features is 0.
Let’s calculate the VIF scores for the features

A lot of features are correlated. As we seen earlier the features numerical_1 and numerical_2 are highly correlated. The features month_lags and purchase_lags are also correlated.
Let’s remove some of the correlated features and calculate the VIF scores again.

After removing some of the highly correlated variables we can see the drastic change in the values.
Eventhough there are variable with VIF greater than 70 instead of removing those right away we can train a model with and without them and check the performance.
The following is the correlation matrix

3.4) HISTORICAL TRANSACTION:
Historical_transaction: Historical transaction data, contains the transaction data of the cards in the training and test set, all cards have at least 3 months of transaction records. Including card ID, month_lag (the number of months relative to the reference date, which is not very easy to translate here), transactions Date purchase_date, whether the transaction was successful authorized_flag, installment purchases, merchant types merchant_category_id, merchant category subsector_id, merchant ID, transaction amount purchase_amount, transaction city and state, and 3 anonymous categorical variables (category_1, category_2, category_3)


There are null values in the variables category_3, merchant_id and category_2. In category_2 there are almost 9% of the values are missing. These values should be imputed. In the next section we’ll see how we can impute these values.
Let’s explore the feature authorized_flag.

The authorized flag denotes whether a transaction is authorized or not. We can see that there are few unauthorized transactions.
Let’s see the percentage of authorized and unauthorized transactions.

There are around 9% of unauthorized transactions. One thing we could do is we can create features separately for authorized and unauthorized transaction.

The above plot is the distribution of values for the installment feature. It is quite strange that the value of installment ranges from 0 to 1000. Let’s investigate further by looking at the value_counts.

We can see two values -1 and 999.
-1 could be used to fill null values. Let’s try to find what 999 means. Let’s see how many transactions are authorized if the installment is 999.

As we can clearly see a lot of transaction which has installment of 999 are not-authorized. So the value 999 could denote fraud transaction.
4) DATA PRE-PROCESSING AND FEATURE ENGINEERING:
4.1) IMPUTING NULL VALUES WITH ML MODELS:
In the exploratory analysis we see that there are a lot of null values. I’ll use Logistic Regression to impute those values which are categorical and KNN to impute the values which are numerical.
We’ll see how to do it for the merchant data. Let’s print the null values in merchant data.
We’ll use KNNRegressor for the numerical features avg_sales_lag and use LogisticRegression for categorical feature category_2.
|
1 2 3 4 5 6 7 8 9 10 11 12 13 14 15 16 17 18 19 20 21 22 23 24 25 26 27 28 29 30 31 32 33 34 35 36 37 38 39 40 41 42 43 44 45
|
#https://medium.com/towards-artificial-intelligence/handling-missing-data-for-advanced-machine-learning-b6eb89050357 from sklearn.neighbors import KNeighborsRegressor merchant = merchant[merchant[‘avg_purchases_lag3’]!=np.inf] tmp = pd.DataFrame() tmp[‘merchant_id’] = merchant[‘merchant_id’] tmp[‘category_2’] = merchant[‘category_2’] merchant.drop([‘merchant_id’, ‘category_2’], axis=1, inplace=True) merchant = lab_enc(merchant, [‘category_4’,‘category_1’,‘most_recent_sales_range’,‘most_recent_purchases_range’]) feat = merchant.columns cols = [‘avg_sales_lag3’,‘avg_sales_lag6’,‘avg_sales_lag12’] no_nan = [] for c in feat: if c not in cols: no_nan.append(c) test = merchant[merchant[‘avg_sales_lag3’].isna()] train = merchant.dropna() clf = KNeighborsRegressor(n_neighbors=5) clf.fit(train[no_nan], train[‘avg_sales_lag3’]) merchant.loc[merchant[‘avg_sales_lag3’].isna(), ‘avg_sales_lag3’] = clf.predict(test[no_nan]) test = merchant[merchant[‘avg_sales_lag6’].isna()] train = merchant.dropna() clf2 = KNeighborsRegressor(n_neighbors=5) clf2.fit(train[no_nan], train[‘avg_sales_lag6’]) merchant.loc[merchant[‘avg_sales_lag6’].isna(), ‘avg_sales_lag6’] = clf2.predict(test[no_nan]) test = merchant[merchant[‘avg_sales_lag12’].isna()] train = merchant.dropna() clf3 = KNeighborsRegressor(n_neighbors=5) clf3.fit(train[no_nan], train[‘avg_sales_lag12’]) merchant.loc[merchant[‘avg_sales_lag12’].isna(), ‘avg_sales_lag12’] = clf3.predict(test[no_nan]) merchant[‘category_2’] = tmp[‘category_2’] merchant.isna().sum() |

Now we’ll use LogisticRegression to impute the categorical values.
|
1 2 3 4 5 6 7 8 9 10 11 12 13 14 15 16 17
|
from sklearn.neighbors import KNeighborsClassifier from sklearn.linear_model import LogisticRegression feat = merchant.columns cols = [‘category_2’] no_nan = [] for c in feat: if c not in cols: no_nan.append(c) test = merchant[merchant[‘category_2’].isna()] train = merchant.dropna() clf = LogisticRegression() clf.fit(train[no_nan], train[‘category_2’]) merchant.loc[merchant[‘category_2’].isna(), ‘category_2’] = clf.predict(test[no_nan]) |

We have imputed all the missing values in this data set. Similarly we can do the same for other datasets also.
After imputing all the missing values we have to one hot encode all the categorical features.
The following snippet of code will transform all the categorical variables in the new merchant data.
|
|
cat_2 = [1.,2.,3.,4.,5.] cat_3 = [0,1,2,3] mont = [1,2] for val in mont: new_merchant[‘month_lag={}’.format(val)] = (new_merchant[‘month_lag’] == val).astype(int) for val in cat_2: new_merchant[‘category_2={}’.format(int(val))] = (new_merchant[‘category_2’] == val).astype(int) for val in cat_3: new_merchant[‘category_3={}’.format(int(val))] = (new_merchant[‘category_3’] == val).astype(int) |
4.2) FEATURE ENGINEERING:
I managed to create around 330 features. Some of the features I created are.
- Creating features out of the date columns like adding whether it is a weekday, weekend, any special festive day or holiday, difference between dates, first and last registered dates. Could also engineer a feature like if a purchase is made within days before or after a festival then we can call it an influential day for making a purchase.
- Transaction count (count)/success and failure count for each card_id
- Creating agg. features grouped by card_id and merchant_id like finding the count of the purchases a particular card_id made and perform typical aggregate features like avg, min, max.
- The ratio of weekends and working days for each card_id transaction
- The statistical features like finding min, max, difference, average, percentiles of the time difference of the card_id transaction and many more aggregate features.
The following is the sample list of features created.
|
1 2 3 4 5 6 7 8 9 10 11 12 13 14 15 16 17 18 19 20 21 22 23 24 25 26
|
History info features: Index([‘Unnamed: 0’, ‘card_id’, ‘hist_transac_count’, ‘hist_transac_city_id_nunique’, ‘hist_transac_state_id_nunique’, ‘hist_transac_merchant_category_id_nunique’, ‘hist_transac_subsector_id_nunique’, ‘hist_transac_merchant_id_nunique’, ‘hist_transac_category_1_sum’, ‘hist_transac_category_0_sum’, ‘hist_transac_category_1_mean’, ‘hist_transac_category_1_std’, ‘hist_transacinstallments_mean’, ‘hist_transacinstallments_sum’, ‘hist_transacinstallments_max’, ‘hist_transacinstallments_min’, ‘hist_transacinstallments_std’, ‘hist_transacinstallments_skew’, ‘new_transac_category_2=1_mean’, ‘new_transac_category_2=1_sum’, ‘new_transac_category_2=2_mean’, ‘new_transac_category_2=2_sum’, ‘new_transac_category_2=3_mean’, ‘new_transac_category_2=3_sum’, ‘new_transac_category_2=4_mean’, ‘new_transac_category_2=4_sum’, ‘new_transac_category_2=5_mean’, ‘new_transac_category_2=5_sum’, ‘new_transac_category_3=0_mean’, ‘new_transac_category_3=0_sum’, ‘new_transac_category_3=1_mean’, ‘new_transac_category_3=1_sum’, ‘new_transac_category_3=2_mean’, ‘new_transac_category_3=2_sum’, ‘new_transac_category_3=3_mean’, ‘new_transac_category_3=3_sum’, ‘hist_transacmonth_lag_count_std’, ‘hist_transacmonth_lag_count_max’, ‘hist_transac_authorized_flag_sum’, ‘hist_transac_authorized_flag_mean’, ‘hist_transac_denied_count’, ‘hist_transac_merchant_id_count_mean’, ‘hist_transac_merchant_count_max’, ‘hist_transac_merchant_count_max_sum_ratio’, ‘hist_transac_merchant_id_count_max_mean_ratio’, ‘hist_transac_merchant_count_std’], dtype=‘object’) |
4.3) FEATURE SELECTION:
Since we have a lot of features around 340 it is always good to select features based on feature importance.
We’ll use Recursive Feature Elimination method to select the features.
|
|
from lightgbm import LGBMRegressor from sklearn.feature_selection import RFECV clf = LGBMRegressor(boosting_type=‘gbdt’, objective=‘regression’, num_iteration=10000,num_leaves=120, min_data_in_leaf=90,max_depth=8, learning_rate=0.01, feature_fraction= 0.7, bagging_freq= 1,bagging_fraction= 0.9,data_random_seed= 11,metric= ‘rmse’,lambda_l1=0.4, verbosity= –1,random_state= 4950) rfe = RFECV(estimator=clf, step=3, cv=StratifiedKFold(n_splits=2, random_state=42) \ .split(train_df[train_cols],outliers.values), \ n_jobs=1, verbose=2) rfe.fit(train_df[train_cols],target) |
After the feature selection we are left with 254 features. We’ll use the features which are selected by the RFE for building the model.
5) MODEL BUILDING:
I have trained a total of 9 models. The following is the comparison of the performance of the models.

We’ll first train a Lightgbm model using the features trained by the Recursive Feature Elimination. The hyper parameters for the Lightgbm model were tuned using Optuna.
The following are the values returned by Optuna.
|
|
params = { num_leaves: 60 colsample_bytree: 0.35120050902766814 subsample: 0.7640712594837535 max_depth: 6 reg_alpha: 4.054941002128766 reg_lambda: 9.687137168616093 min_split_gain: 2.160075593248262 min_child_weight: 16.067553828016983 min_data_in_leaf: 17 } |
We’ll use these parameters to train the model.
|
1 2 3 4 5 6 7 8 9 10 11 12 13 14 15 16 17 18 19 20 21 22 23 24 25 26 27 28 29 30 31 32 33 34 35 36 37 38 39 40 41 42 43
|
param = { ‘colsample_bytree’: 0.35120050902766814, ‘subsample’: 0.7640712594837535, ‘max_depth’: 6, ‘reg_alpha’: 4.054941002128766, ‘reg_lambda’: 9.687137168616093, ‘min_split_gain’: 2.160075593248262, ‘min_child_weight’: 16.067553828016983, ‘min_data_in_leaf’: 17, ‘objective’ : ‘regression’, ‘boosting_type’ : ‘gbdt’, ‘metric’ : ‘rmse’, ‘learning_rate’ : 0.01, ‘num_leaves’ : 60, ‘data_random_seed’ : 2019, ‘max_bin’ : 255, ‘nthread’ : 8 } #prepare fit model with cross-validation folds = StratifiedKFold(n_splits=9, shuffle=True, random_state=2019) oof = np.zeros(len(train_df)) predictions = np.zeros(len(test_df)) feature_importance_df = pd.DataFrame() #run model for fold_, (trn_idx, val_idx) in enumerate(folds.split(train_df,train_df[‘outliers’].values)): print(“fold {}”.format(fold_)) trn_data = lgb.Dataset(train_df.iloc[trn_idx][train_cols], label=target.iloc[trn_idx])#, categorical_feature=categorical_feats) val_data = lgb.Dataset(train_df.iloc[val_idx][train_cols], label=target.iloc[val_idx])#, categorical_feature=categorical_feats) num_round = 10000 clf = lgb.train(param, trn_data, num_round, valid_sets = [trn_data, val_data], verbose_eval=200, early_stopping_rounds = 150) oof[val_idx] = clf.predict(train_df.iloc[val_idx][train_cols], num_iteration=clf.best_iteration) #feature importance fold_importance_df = pd.DataFrame() fold_importance_df[“Feature”] = train_cols fold_importance_df[“importance”] = clf.feature_importance() fold_importance_df[“fold”] = fold_ + 1 feature_importance_df = pd.concat([feature_importance_df, fold_importance_df], axis=0) #predictions predictions += clf.predict(test_df[train_cols], num_iteration=clf.best_iteration) / folds.n_splits
print(“”.format(np.sqrt(mean_squared_error(oof, target)))) |
The below is the score we got upon submission in Kaggle.

Let’s train the LightGBM with all the features and check the score. Using all the features does increase the performance of the model. The score of the model increased from 3.61287 to 3.61084 which is a huge improvement.

Since using all the feature gives better performance compare to the features returned by RFE we’ll use all the features to train any further models.
Let’s train the XGBOOST model with all the features.
The parameters for the XGBOOST are tuned using RandomSearchCV. If you don’t know what RandomSearchCV is you can read my article Introduction to RandomSearchCV.
|
1 2 3 4 5 6 7 8 9 10 11 12 13 14 15 16 17 18 19 20 21 22 23 24 25 26 27 28 29 30 31 32
|
import xgboost as xgb from sklearn.model_selection import KFold from sklearn.metrics import mean_squared_error
xgb_params = { ‘eta’: 0.3, ‘max_depth’: 6, ‘subsample’: 0.8, ‘colsample_bytree’: 0.9, \ ‘learning_rate’:0.01, ‘gamma’:0.3, ‘min_samples_leaf’ : 7, ‘min_samples_split’: 7, \ ‘num_boost_round’: 25, ‘reg_alpha’: 1e–05,‘objective’: ‘reg:linear’, ‘eval_metric’: ‘rmse’, \ ‘silent’: True, ‘tree_method’:‘gpu_hist’ }
FOLDs = KFold(n_splits=9, shuffle=True, random_state=1989)
oof_xgb = np.zeros(len(train_df)) predictions_xgb = np.zeros(len(test_df))
for fold_, (trn_idx, val_idx) in enumerate(FOLDs.split(train_df,outliers.values)): trn_data = xgb.DMatrix(data=train_df.iloc[trn_idx], label=target.iloc[trn_idx]) val_data = xgb.DMatrix(data=train_df.iloc[val_idx], label=target.iloc[val_idx]) watchlist = [(trn_data, ‘train’), (val_data, ‘valid’)] print(“xgb “ + str(fold_) + “-“ * 50) num_round = 10000 xgb_model = xgb.train(xgb_params, trn_data, num_round, watchlist, \ early_stopping_rounds=200, verbose_eval=200) oof_xgb[val_idx] = xgb_model.predict(xgb.DMatrix(train_df.iloc[val_idx]), \ ntree_limit=xgb_model.best_ntree_limit+50)
predictions_xgb = predictions_xgb + xgb_model.predict(xgb.DMatrix(test_df), \ ntree_limit=xgb_model.best_ntree_limit+50) / FOLDs.n_splits
np.sqrt(mean_squared_error(oof_xgb, target)) |

Not as good as the LightGBM model. Let’s try blending the predictions of LGB and XGB. We’ll give 80% weight to the LGB predictions and 20% to the XGB predictions.

The score which we obtained from blending is better than the XGBOOST model.
Let’s try training a meta-model on the predictions of LGB and XGB. We’ll train a Ridge as a meta-model.
|
1 2 3 4 5 6 7 8 9 10 11 12 13 14 15 16 17 18 19 20 21 22 23 24
|
#loading the predictions of the trained lgb and xgb models to feed as the input to the meta learner oof_xgb = np.load(‘/content/drive/My Drive/case study/oof_xgb_323_feat.npy’) pred_xgb = np.load(‘/content/drive/My Drive/case study/pred_xgb_323_feat.npy’) oof_lgb = np.load(‘/content/drive/My Drive/case study/oof_lgb_tuned_323_final_stack.npy’) pred_lgb = np.load(‘/content/drive/My Drive/case study/pred_lgb_tuned_323.npy_final_stack.npy’) train_stack = np.vstack([oof_xgb, oof_lgb]).transpose() test_stack = np.vstack([pred_xgb, pred_lgb]).transpose() from sklearn.linear_model import Ridge from sklearn.model_selection import StratifiedKFold folds = StratifiedKFold(n_splits=5, shuffle=True, random_state=15) oof_stacked = np.zeros(train_stack.shape[0]) predictions_stacked = np.zeros(test_stack.shape[0]) for fold_, (trn_idx, val_idx) in enumerate(folds.split(train_stack, outliers.values)): print(“Starting fold n={}”.format(fold_)) trn_data, trn_y = train_stack[trn_idx], target.iloc[trn_idx].values val_data, val_y = train_stack[val_idx], target.iloc[val_idx].values clf = Ridge(alpha=1) clf.fit(trn_data, trn_y) oof_stacked[val_idx] = clf.predict(val_data) predictions_stacked = predictions_stacked + clf.predict(test_stack) / folds.n_splits |

Stacking the model increases the performance of the model by 0.004 Our previous best score was from a single LGB model which is 3.61084
Let’s try some Neural network based models and see whether we can increase the performance.
First I tried a simple ANN with 5 layers.
|
1 2 3 4 5 6 7 8 9 10 11 12 13 14 15 16 17 18 19 20 21 22 23
|
from sklearn.datasets import load_boston from keras.models import Sequential from keras.layers import Dense, Conv1D, Flatten, Dropout, MaxPooling1D, BatchNormalization from sklearn.model_selection import train_test_split from sklearn.metrics import mean_squared_error from keras import backend as K from keras.callbacks import EarlyStopping early_stop = EarlyStopping(monitor=‘loss’,patience=6, verbose=1, mode=‘auto’) def root_mean_squared_error(y_true, y_pred): return K.sqrt(K.mean(K.square(y_pred – y_true))) model = Sequential() model.add(Dense(64, activation=‘relu’, input_shape=(train_df[train_cols].shape[1],))) model.add(Dense(32, activation=‘relu’)) model.add(Dropout(0.25)) model.add(Dense(16, activation=‘relu’)) model.add(BatchNormalization()) model.add(Dense(8, activation=‘relu’)) model.add(Dense(1)) model.compile(loss=root_mean_squared_error, optimizer=“adam”) model.fit(train_df[train_cols], target, batch_size=64, epochs=50, verbose=2, callbacks=[early_stop]) |
Upon submission on Kaggle I get a score of 3.81882 which is far worse than the LGB and stacked model.

Let’s try a CNN+LSTM model
|
1 2 3 4 5 6 7 8 9 10 11 12 13 14 15 16 17 18 19 20 21 22 23 24
|
from keras.layers import Embedding from keras.models import Sequential from keras.layers import Dense, Conv1D, Flatten, Dropout, MaxPooling1D from keras.layers import BatchNormalization, LSTM from sklearn.metrics import mean_squared_error from keras import backend as K from keras.callbacks import EarlyStopping, ModelCheckpoint def root_mean_squared_error(y_true, y_pred): return K.sqrt(K.mean(K.square(y_pred – y_true))) filepath = ‘/content/drive/My Drive/case study/weight/weights-{epoch:02d}-{loss:.2f}.hdf5’ early_stop = EarlyStopping(monitor=‘loss’,patience=6, verbose=1, mode=‘auto’) model_ckpt = ModelCheckpoint(monitor=‘loss’, save_best_only=True, verbose=1, mode=‘auto’,filepath=filepath) model = Sequential() model.add(Embedding(324, 128, input_length=324)) model.add(Dropout(0.25)) model.add(Conv1D(64,3,padding=‘valid’,activation=‘relu’,strides=1)) model.add(MaxPooling1D(2)) model.add(LSTM(50)) model.add(Dense(1)) model.compile(optimizer=‘adam’, loss=root_mean_squared_error) |
The score improved comparing with the ANN model. The score we get is 3.68342. However it is still not as great as a single LGB model.

Our best model i.e., the stacked model of XGB and LGB puts us in the top 4% in the leaderboard.

Conclusion and Future Work:
We started off with detailed Exploratory Data Analysis. Based on our findings in the EDA we performed some pre-processing steps like imputing missing values using ML models, creating new features as the features which are inherently present in the dataset are not that much useful etcetera.
We created a total of 340 features. Then we performed Recursive Feature Elimination to select important features. At the end of RFE we are left with 274 features.
While modelling we found out that using all the features instead of using only the features selected by RFE does increase the performance of the model. So we did the modelling using all the features.
We tried a variety of models. The models lightGBM and XGBOOST performs well for this data set. The stacking of these two models gives us the best score.
The neural network based models were not that much performant when compared to LightGBM or XGBOOST.
If we want to further improve the performance, for starters we could train different models to predict the data with outlier and without outlier separately.
- First we’ll train a model without outlier. Let’s say model A.
- Now train another model to classify the outliers. Say model B.
- By using the model B we can classify outliers in the test data. Now we can use the model A which we trained to predict the target for data without outliers.
We can try linear stacking as described in the 1st place solution which gives him a good performance boost.
As far as neural network is concerned we can try different architectures to increase the performance of the model.
To get the complete code visit this GithubRepo.
References:
1) https://www.kaggle.com/fabiendaniel/elo-world
2) https://www.kaggle.com/samaxtech/eda-clean-feng-lgbm-xgboost-stacked-model
3) https://www.kaggle.com/youhanlee/hello-elo-ensemble-will-help-you
4) https://brunogomescoelho.github.io/kaggle/elo_merchant/
5) https://github.com/chandureddivari/kaggle
6) https://github.com/bangd/kaggle/
7) https://www.kaggle.com/juyeong1537/juyeong-merchant-eda
8) https://github.com/bestpredicts/ELO/blob/master/zxs/pre_0214.ipynb
9) https://www.kaggle.com/sudalairajkumar/simple-exploration-notebook-elo